How to Measure Success in Enterprise Ticketing Systems: A Practical Guide to Key Metrics and KPIs

Your ticketing system generates thousands of data points every day. Response times, resolution rates, satisfaction scores, ticket volumes. But data without direction is just noise. How do you turn these numbers into actions that actually improve your support operation?
This guide shows you exactly how to measure what matters in enterprise ticketing systems. You'll learn how to calculate the metrics that drive success, set realistic targets for your team, spot problems before they become disasters, and use data to make your support operation better every month.
Why These Metrics Matter
Before diving into specific metrics, understand this: tracking numbers for the sake of tracking accomplishes nothing. Every metric you measure should answer a specific question about your operation [1].
First Response Time answers: Are we responding to customers quickly enough?
Resolution Time answers: Are we solving problems efficiently?
CSAT Scores answer: Are customers happy with our support?
Ticket Volume Trends answer: Where should we focus our resources?
Together, these metrics tell you if your ticketing system works or if it's drowning your team while frustrating your customers.
Metric 1: First Response Time (FRT)
What It Measures
First Response Time measures how long it takes your team to send an initial reply after a customer opens a ticket [2]. The clock starts when the ticket is created and stops when a human agent sends the first response (automated replies don't count) [3].
Speed matters here because 66% of customers say that valuing their time is the most important thing a company can do to provide good service [4]. A fast first response doesn't solve the problem yet, but it tells customers you've received their message and are working on it.
How to Calculate It
The formula is simple [5]:
FRT = Time of First Response minus Time of Ticket Creation
For a single ticket: If a ticket comes in at 9:00 AM and you respond at 10:00 AM, your FRT is 1 hour.
For your team average [6]:
Average FRT = Total First Response Time for All Tickets divided by Number of Resolved Tickets
Example: If your team resolves 200 tickets in a month with a combined first response time of 800 hours, your average FRT is 4 hours (800 ÷ 200).
How to Measure It Correctly
Measure in business hours only. If a ticket arrives Friday at 5 PM and you respond Monday at 9 AM, don't count the weekend. This gives you accurate data about your team's actual availability [7].
Use median instead of average when possible. A few tickets with extremely long or short response times can skew your average. The median gives a more accurate picture of typical performance [8].
Exclude automated responses. Only count replies from actual humans. Chatbot acknowledgments don't tell customers anything meaningful [9].
Track by channel separately. Email FRT looks different from live chat FRT. Mix them together and your data loses meaning. Industry benchmarks show email FRT of 4-17 hours depending on industry, while live chat should be under 45 seconds [10].
What's a Good FRT?
It depends on your channel and industry [11]:
- Live chat: 45 seconds or less
- Email: 4 hours or less for competitive industries
- Phone: 3 minutes or less wait time
- Social media: 4 hours or less
Industry averages from 2023 show [12]:
- Real estate: 15 hours
- E-commerce: 17 hours
- Financial services: 14 hours
Don't obsess over matching these numbers exactly. Track your current baseline, then work to improve it by 10-15% per quarter.
How to Improve It
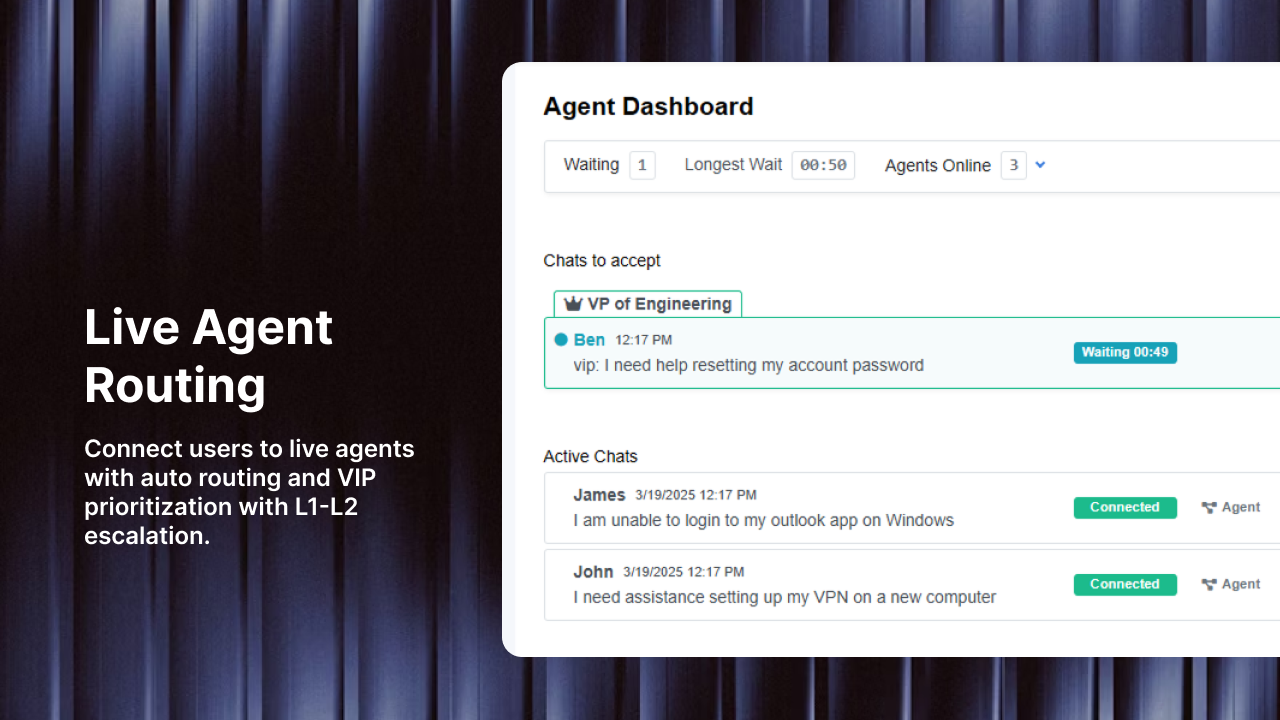
Set up automated ticket routing. When tickets land immediately in the right agent's queue, responses happen faster. Skills-based routing cuts FRT by assigning tickets to agents with relevant expertise [13].
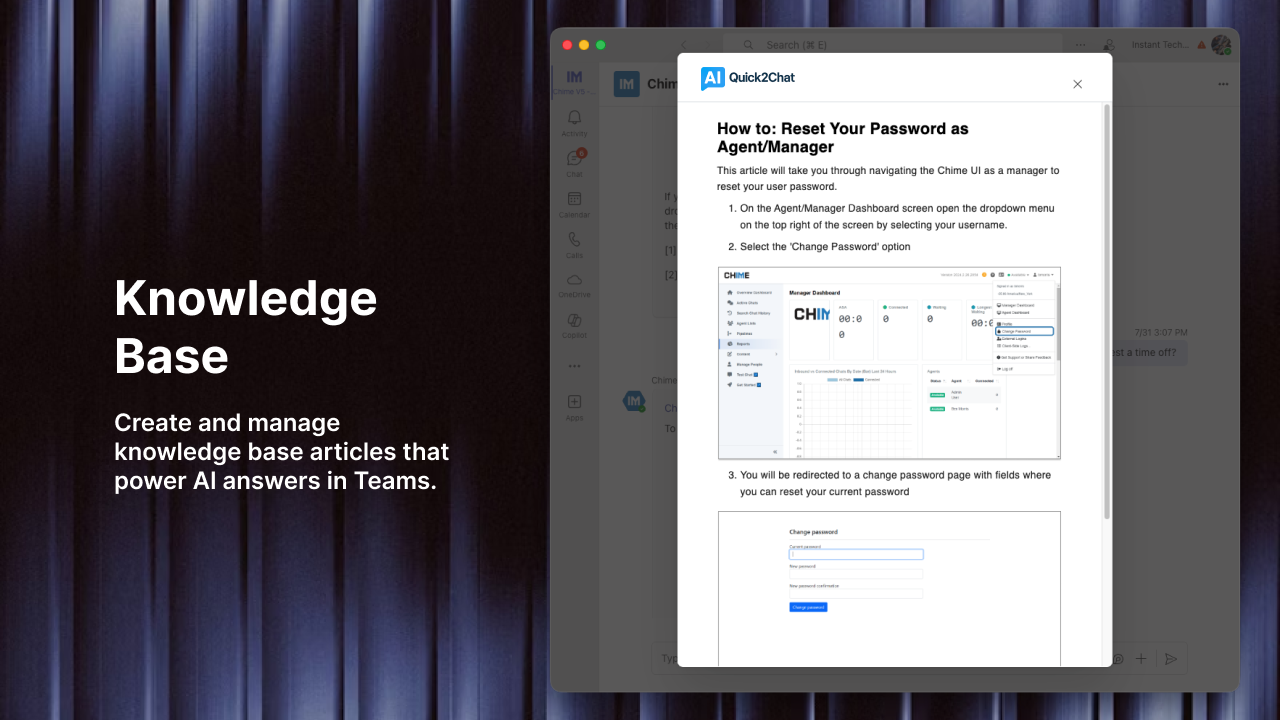
Build a knowledge base for agents. When agents can quickly find answers to common questions, they respond faster. This also helps new team members get up to speed [14].
Create response templates for common issues. Not copy-paste robots, but starting points that agents can personalize. This saves the 5-10 minutes spent typing the same information repeatedly [15].
Monitor FRT in real-time. Display current FRT on team dashboards. When agents see the number creeping up, they can adjust priorities [16].
Staff for peak times. Analyze when tickets flood in. Universities see spikes at semester start. Retailers peak during holidays. Schedule more agents during these predictable surges [17].
Metric 2: Resolution Time (or Time to Resolution)
What It Measures
Resolution Time tracks how long it takes to completely solve a customer's problem [18]. The clock starts when the ticket is created and stops when the issue is marked as resolved and the customer accepts the solution.
This matters more than FRT for overall customer satisfaction. According to research, 63% of customers will leave a brand after a single bad customer service experience, and slow resolution is a leading cause [19].
How to Calculate It
For a single ticket [20]:
Resolution Time = Time Ticket Closed minus Time Ticket Created
For your team average [21]:
Average Resolution Time = Total Resolution Time for All Resolved Tickets divided by Number of Tickets Resolved
Example: Your team resolves 300 tickets in a week. The combined time to resolve all tickets is 1,500 hours. Your average resolution time is 5 hours (1,500 ÷ 300).
Important Distinctions
First Resolution Time vs. Full Resolution Time: First Resolution Time counts from ticket creation to the first time it's marked solved. Full Resolution Time includes if the ticket gets reopened [22]. Track both. You want them as close together as possible.
Exclude pending and on-hold time from calculations. When you're waiting for the customer to respond or a third party to act, that shouldn't count against your team's resolution time [23].
Business hours vs. calendar hours: Like FRT, measure in business hours unless you provide 24/7 support. A ticket opened Friday afternoon and closed Monday morning should count as a few hours, not three days [24].
What's a Good Resolution Time?
This varies wildly based on:
- Channel: Email conversations naturally take longer than live chat
- Product complexity: Simple software has faster resolution than enterprise systems
- Team maturity: Established teams outperform new teams
- Issue complexity: Password resets take minutes; bugs take days [25]
General guidelines [26]:
- Simple issues: Under 2 hours
- Standard requests: 4-8 hours
- Complex problems: 24-48 hours
- Major incidents: Based on SLA agreements
Stop comparing yourself to industry averages and start tracking your own baseline. Then improve it.
How to Improve It
Reduce wait times at every step. The biggest delay isn't solving the problem. It's waiting for information, waiting for escalation, waiting for approvals. Map your ticket workflow and eliminate waiting [27].
Implement tiered support. Route simple issues to Level 1. Escalate complex issues to specialists immediately instead of bouncing them around [28]. This prevents tickets from sitting in the wrong queue.
Create clear escalation rules. When should a ticket move to the next level? Make the criteria obvious. "If you can't resolve in 30 minutes" or "If it requires database access" [29].
Build self-service options. Some customers prefer solving problems themselves. A good knowledge base reduces ticket volume and frees agents to focus on complex issues [30].
Set realistic SLA targets. If your current average resolution time is 8 hours, don't set an SLA of 2 hours. You'll miss constantly and demoralize your team. Set targets that stretch your team without breaking them [31].
Analyze resolution time by category. Some ticket types take longer. That's fine. But if "password reset" tickets are taking 4 hours, you have a process problem [32].
Metric 3: Customer Satisfaction Score (CSAT)
What It Measures
CSAT shows how satisfied customers are with your support [33]. Unlike FRT and resolution time which measure your team's speed, CSAT measures the customer's actual experience.
You can respond in 30 seconds and resolve in 10 minutes, but if you're rude or unhelpful, your CSAT will be terrible. This metric catches what others miss.
How to Calculate It
CSAT comes from post-interaction surveys. You ask customers "How satisfied were you with your support experience?" and give them a rating scale [34].
Common scales:
- 5-point scale: 1 (very dissatisfied) to 5 (very satisfied)
- 10-point scale: 1 (very dissatisfied) to 10 (very satisfied)
- Simplified binary: Thumbs up or thumbs down
The calculation [35]:
CSAT Score = (Number of Satisfied Responses divided by Total Number of Responses) × 100
A satisfied response is typically a 4 or 5 on a 5-point scale, or an 8-10 on a 10-point scale [36].
Example: You receive 500 survey responses. 400 customers rate their experience 4 or 5 out of 5. Your CSAT score is 80% (400 ÷ 500 × 100).
When to Send CSAT Surveys
Timing matters. Send surveys [37]:
Immediately after ticket closure: When the experience is fresh in the customer's mind After major support interactions: Following complex troubleshooting or escalations Before subscription renewals: Catch dissatisfaction early enough to fix it During periods of customer inactivity: If engagement drops, a survey might uncover why
Keep surveys short. One question with an optional comment field works better than ten questions nobody completes [38].
What's a Good CSAT Score?
According to the American Customer Satisfaction Index, most industries average between 65-75% [39]. Specific industry benchmarks from 2023 data [40]:
- Technology/Software: 78-82%
- Financial Services: 76-80%
- Retail/E-commerce: 75-79%
- Healthcare: 73-77%
A CSAT score between 75-80% puts you in good company. Above 80% is exceptional. Below 70% signals serious problems requiring immediate attention [41].
How to Interpret Your Score
80-100%: Excellent. Most customers are very satisfied. 70-79%: Good. Most customers are satisfied, but room for improvement exists. 60-69%: Fair. Many customers are only moderately satisfied. Focus on improvements. Below 60%: Poor. Urgent action needed to address customer dissatisfaction [42].
How to Improve It
Follow up on every negative survey. When someone rates you poorly, reach out immediately. Often you can save the relationship and learn what went wrong [43].
Track CSAT by agent. Some agents consistently score higher. What are they doing differently? Share those techniques with the team [44].
Look for patterns in low scores. Are certain ticket types getting bad ratings? Specific times of day? Particular channels? The patterns point to solutions [45].
Balance speed with quality. Fast responses matter, but not if you're giving unhelpful answers. Make sure FRT improvements don't come at the expense of actual problem-solving [46].
Train agents on soft skills. Technical knowledge matters, but empathy, clear communication, and patience drive satisfaction scores higher [47].
Set up a feedback loop. Share CSAT results with agents regularly. Don't make it punitive. Use it for coaching and improvement [48].
Metric 4: Ticket Volume Trends
What It Measures
Ticket volume tracks the total number of support requests your team handles over time [49]. Unlike the previous metrics that measure quality, this one measures quantity.
Volume trends tell you if demand is growing, shrinking, or staying stable. They help you plan staffing, identify product issues, and spot seasonal patterns [50].
How to Calculate It
This one is simple [51]:
Ticket Volume = Total Number of Tickets Created in a Time Period
But the real value comes from tracking it over time and breaking it down:
By time period: Daily, weekly, monthly, quarterly By category: Hardware, software, network, access requests By channel: Email, phone, chat, self-service portal By priority: P1 critical, P2 high, P3 medium, P4 low By status: New, open, pending, resolved, closed
What to Watch For
Sudden spikes: A sharp increase in ticket volume often signals a problem. System outage? Bad software release? Product defect? Investigate immediately [52].
Gradual upward trends: Steady growth might mean your customer base is expanding (good) or your product is getting harder to use (bad). Context matters [53].
Seasonal patterns: Many organizations see predictable ticket volume changes. Universities spike at semester start. Retailers peak during holidays. B2B companies surge end of quarter [54].
Channel distribution changes: If chat volume drops while email surges, customers might be frustrated with chat response times and switching channels [55].
Category imbalances: If 40% of your tickets are password resets, you need better self-service password reset tools, not more agents [56].
How to Use Volume Data
Staffing decisions: When you know Mondays see 35% higher volume than Fridays, schedule more agents on Mondays [57].
Product improvements: Sudden spikes in specific ticket categories point to product problems that need fixing. A 30% increase in "can't log in" tickets should trigger investigation [58].
Resource allocation: If network issues generate 20% of tickets but only 5% of your team specializes in networking, rebalance [59].
Self-service investments: High-volume, low-complexity categories (password resets, basic how-tos) are perfect candidates for knowledge base articles or automated solutions [60].
Capacity planning: Gradual upward trends mean you'll need more agents soon. Use historical data to forecast when [61].
How to Analyze Trends Effectively
Normalize volume by customer count. Raw ticket numbers mislead as you grow. Instead track "tickets per customer" or "tickets per 1,000 users" [62].
Example: 500 tickets with 1,000 customers = 0.5 tickets per customer. Next quarter: 600 tickets with 1,500 customers = 0.4 tickets per customer. Your volume increased but your per-customer demand actually decreased.
Compare week-over-week and year-over-year. Week-over-week shows short-term changes. Year-over-year accounts for seasonal variations [63].
Create distribution reports. Break volume down by time of day and day of week. This reveals your actual demand pattern [64].
Track by ticket type. Don't just count total tickets. Count how many are incidents vs. service requests vs. questions. Different ticket types need different responses [65].
Using Metrics Together for Continuous Improvement
Individual metrics tell you pieces of the story. Combined, they reveal the complete picture of your support operation's health.
The Monthly Review Process
Set aside time each month to review your metrics together. Here's a practical framework:
Step 1: Gather Your Data
Pull reports for the past month showing:
- Average FRT and distribution by ticket priority
- Average resolution time by category
- CSAT score overall and by agent
- Total ticket volume and trends by category
- Any SLA compliance metrics [66]
Step 2: Look for Correlations
Ask these questions:
Did FRT increase? Check if ticket volume also spiked. More tickets might be overwhelming your team.
Did resolution time spike for specific categories? Maybe a recent product change introduced complexity.
Did CSAT drop for certain agents? Check their FRT and resolution times. Or look for patterns in ticket types they're handling.
Is ticket volume increasing in specific categories? This might signal product issues needing engineering attention [67].
Step 3: Identify Root Causes
Don't stop at symptoms. If CSAT is down, that's a symptom. Why is it down?
Maybe FRT increased because:
- You launched a new feature that generated more tickets
- Three agents took vacation simultaneously
- Your ticketing system had downtime
- Holiday season started
Or maybe CSAT dropped despite good FRT because:
- Agents are rushing to hit speed targets at the expense of quality
- A new product bug is frustrating customers
- You changed your escalation process and it's not working [68]
Step 4: Set Improvement Targets
Pick 1-3 specific areas to improve next month. Don't try to fix everything at once.
Good targets are specific and measurable [69]:
-
Vague: "Improve FRT"
-
Specific: "Reduce email FRT from 6 hours to 4 hours for P2 tickets"
-
Vague: "Make customers happier"
-
Specific: "Increase CSAT from 72% to 76% by reducing resolution time for password reset tickets"
Step 5: Take Action
For each target, decide:
- What will we change?
- Who is responsible?
- How will we measure progress?
- When will we review results?
Example: To reduce email FRT for P2 tickets:
- Create response templates for the 10 most common P2 ticket types
- Assign Sarah to build templates by next week
- Measure FRT daily for two weeks
- Review results at next month's meeting [70]
Step 6: Track and Adjust
Don't wait a month to check progress. Review key metrics weekly. If something isn't working, adjust your approach.
Maybe templates aren't helping because agents don't know they exist. Add training. Or maybe P2 tickets are complex and templates don't fit. Focus on better routing instead [71].
The Quarterly Deep Dive
Once per quarter, go deeper:
Benchmark against yourself. Compare this quarter to last quarter and the same quarter last year. Are you getting better? [72]
Benchmark against industry standards. How do your numbers stack up? Don't obsess over beating industry averages, but huge gaps in either direction deserve investigation [73].
Review your SLAs. Are they still realistic? Are you consistently hitting them or missing them? Adjust if needed [74].
Analyze ticket patterns. What categories are growing? What's shrinking? This guides training priorities and process improvements [75].
Survey your team. Agents see problems metrics miss. Ask them what's getting in the way of faster, better support [76].
Advanced Techniques
Once you've mastered the basics, these techniques extract more value from your metrics:
Predictive analysis: Use historical volume data to forecast future ticket demand. This improves staffing and prevents surprises [77].
Cohort analysis: Track how metrics change for different customer groups. New customers might have different support needs than long-term customers [78].
Correlation studies: Do specific product releases always cause ticket spikes? Does CSAT drop when resolution time exceeds certain thresholds? Find these relationships [79].
A/B testing: Try different approaches with different teams or customer segments. Measure which produces better outcomes [80].
Common Mistakes to Avoid
Gaming the system. Agents learn what you measure. If you only track FRT, they'll send fast but useless responses. If you only track resolution time, they'll mark tickets solved before actually solving them. Measure multiple metrics to prevent gaming [81].
Ignoring survey response rates. If only 5% of customers complete CSAT surveys, those responses probably come from customers who are either extremely happy or extremely angry. You're missing the middle [82].
Measuring too much. Fifteen metrics tracked monthly leads to analysis paralysis. Pick 4-6 that matter most and track them well [83].
Not acting on data. Tracking metrics without making changes wastes everyone's time. If you're not prepared to act on what you learn, don't bother measuring [84].
Comparing across incomparable things. Your live chat FRT will always beat your email FRT. That's fine. Different channels have different expectations [85].
Focusing only on averages. Averages hide important details. Look at distributions. If your average FRT is 2 hours but 20% of tickets take over 8 hours, you have a problem that the average conceals [86].
Making it punitive. Use metrics to improve processes and provide coaching, not to punish agents. Nothing kills morale faster than treating performance data like a weapon [87].
Putting It All Together: A Real Example
Let's look at how this works in practice.
Your Q3 review shows:
- FRT increased from 3.2 hours to 4.8 hours
- Resolution time stayed flat at 18 hours
- CSAT dropped from 78% to 71%
- Ticket volume increased 22%
Analysis: The 22% volume increase stressed your team, causing slower first responses. Resolution time held steady because you added two agents mid-quarter. But CSAT dropped, suggesting quality suffered despite maintained resolution speed.
Looking deeper:
- Most new tickets are in the "account access" category
- Account access tickets have higher reopening rates (customers not satisfied with first resolution)
- Agents report confusion about the new authentication system launched in Q3
Root cause: The new authentication system is harder to use. Customers can't figure it out, agents don't fully understand it, and initial fixes aren't working.
Actions:
- Work with product team to improve authentication UX
- Create detailed authentication troubleshooting guide for agents
- Build self-service password reset tool to reduce ticket volume
- Add authentication specialist to help team until system stabilizes
Targets for Q4:
- Reduce account access ticket volume by 30% through self-service
- Return FRT to under 3.5 hours as volume decreases
- Increase CSAT back to 75%+ as authentication issues resolve
- Reduce account access ticket reopening rate from 18% to under 10%
Three months later, you review results. Ticket volume dropped 28%, FRT improved to 3.3 hours, and CSAT rebounded to 76%. The authentication specialist helped, but the real win was fixing the product's usability issues.
This is how metrics drive improvement. Not by staring at dashboards, but by using data to spot problems, understand causes, and guide action.
Conclusion
Your enterprise ticketing system generates valuable data every single day. But that data only becomes valuable when you measure the right things, analyze them correctly, and act on what you learn.
Start with these four metrics:
- First Response Time to measure responsiveness
- Resolution Time to track efficiency
- CSAT Scores to gauge customer satisfaction
- Ticket Volume Trends to understand demand patterns
Calculate them correctly. Set realistic targets. Review them regularly. Use them to drive specific improvements.
Stop measuring for measurement's sake. Start measuring to build a support operation that actually works.
References
[1] "How to Measure Your Call Center Ticket System: KPIs & Tools."
[2] "First Response Time (FRT): How to Measure and Improve."
[3] "How To Calculate First Response Time and Improve Your FRT (2025)."
[4] "Customer Service Metric: A Deep-dive Into First Response Time."
[5] "First Reply Time: Boost FRT with These Simple Formulas."
[6] "First Response Time (FRT) | KPI example."
[7] "First reply time: 9 tips to deliver faster customer service."
[8] "First Response Time (FRT) | KPI example."
[9] "How To Calculate First Response Time and Improve Your FRT (2025)."
[10] "Customer Service Metric: A Deep-dive Into First Response Time."
[11] "Customer Service Metric: A Deep-dive Into First Response Time."
[12] "Customer Service Metric: A Deep-dive Into First Response Time."
[13] "Routing and automation options for incoming tickets."
[14] "First reply time: 9 tips to deliver faster customer service."
[15] "First Response Time (FRT): Formula & Template."
[16] "First Response Time: How to Measure & 7 Ways to Improve It."
[17] "8 KPIs that every IT help desk needs to know - KPI 4: Ticket volume trends."
[18] "A Guide to Resolution Time: How to Measure and Lower It."
[19] "A Guide to Resolution Time: How to Measure and Lower It."
[20] "Time to Resolution: What is it, Why You Need it, And How to Calculate it."
[21] "Average Resolution Time | KPI example."
[22] "Average Resolution Time | KPI example."
[23] "Explore recipe: Average ticket resolution time without pending or on-hold time."
[24] "A Guide to Resolution Time: How to Measure and Lower It."
[25] "A Guide to Resolution Time: How to Measure and Lower It."
[26] "What is Average Resolution Time (ART)?"
[27] "What Is Time to Resolution? & How to Reduce It."
[28] "Average Ticket Resolution Time."
[29] "Time to Resolution: What is it, Why You Need it, And How to Calculate it."
[30] "What Is Time to Resolution? & How to Reduce It."
[31] "Definitive Guide to Average Resolution Time."
[32] "Average Resolution Time | KPI example."
[33] "What is CSAT and How to Calculate It?"
[34] "What is CSAT? (+ how to measure it)."
[35] "Customer Satisfaction (CSAT) - KPI Example."
[36] "What is CSAT and How to Calculate It?"
[37] "What is CSAT? How to Measure and Calculate Customer Satisfaction Score."
[38] "Customer Satisfaction (CSAT) - KPI Example."
[39] "What is a Customer Satisfaction Score (and How to Calculate CSAT)."
[40] "What Is CSAT in Contact Centers and How to Measure It."
[41] "Free Online CSAT Calculator for Customer Service."
[42] "Free Online CSAT Calculator for Customer Service."
[43] "CSAT: How to Measure and Improve the Customer Service Experience."
[44] "Customer Satisfaction (CSAT) - KPI Example."
[45] "CSAT: How to Measure and Improve the Customer Service Experience."
[46] "How to Track & Optimize First Response Time."
[47] "What Is CSAT in Contact Centers and How to Measure It."
[48] "CSAT: How to Measure and Improve the Customer Service Experience."
[49] "Ticket Volume | KPI example."
[50] "How can you use IT service desk ticket volume to identify trends?"
[51] "Ticket Volume | KPI example."
[52] "8 KPIs that every IT help desk needs to know - KPI 4: Ticket volume trends."
[53] "8 KPIs that every IT help desk needs to know - KPI 4: Ticket volume trends."
[54] "8 KPIs that every IT help desk needs to know - KPI 4: Ticket volume trends."
[55] "How to Measure Your Call Center Ticket System: KPIs & Tools."
[56] "Ticket Volume: Measuring Customer Support Demand."
[57] "Support Ticket Volume: The Critical Metric That Can Transform Your Customer Service Strategy."
[58] "Support Ticket Volume: The Critical Metric That Can Transform Your Customer Service Strategy."
[59] "How can you use IT service desk ticket volume to identify trends?"
[60] "Support Ticket Volume: The Critical Metric That Can Transform Your Customer Service Strategy."
[61] "Support Ticket Volume: The Critical Metric That Can Transform Your Customer Service Strategy."
[62] "Support Ticket Volume: The Critical Metric That Can Transform Your Customer Service Strategy."
[63] "Ticket Trends Report in Desk365."
[64] "Ticket Volume Trends in Freshdesk Analytics."
[65] "How can you use IT service desk ticket volume to identify trends?"
[66] "The Ultimate Guide to Ticket Analysis for Business Success."
[67] "The Ultimate Guide to Ticket Analysis for Business Success."
[68] "The Ultimate Guide to Ticket Analysis for Business Success."
[69] "Time to Resolution: What is it, Why You Need it, And How to Calculate it."
[70] "How can you use IT service desk ticket volume to identify trends?"
[71] "How can you use IT service desk ticket volume to identify trends?"
[72] "The Ultimate Guide to Ticket Analysis for Business Success."
[73] "What is a Customer Satisfaction Score (and How to Calculate CSAT)."
[74] "How to Measure Your Call Center Ticket System: KPIs & Tools."
[75] "The Ultimate Guide to Ticket Analysis for Business Success."
[76] "How can you use IT service desk ticket volume to identify trends?"
[77] "Support Ticket Volume: The Critical Metric That Can Transform Your Customer Service Strategy."
[78] "Support Ticket Volume: The Critical Metric That Can Transform Your Customer Service Strategy."
[79] "Support Ticket Volume: The Critical Metric That Can Transform Your Customer Service Strategy."
[80] "The Ultimate Guide to Ticket Analysis for Business Success."
[81] "First Response Time (FRT): Formula & Template."
[82] "Customer Satisfaction (CSAT) - KPI Example."
[83] "How to Measure Your Call Center Ticket System: KPIs & Tools."
[84] "How can you use IT service desk ticket volume to identify trends?"
[85] "A Guide to Resolution Time: How to Measure and Lower It."
[86] "First Response Time (FRT) | KPI example."
[87] "CSAT: How to Measure and Improve the Customer Service Experience."